In my classroom I have always been big on graphic organizers and pictures to help students understand the concepts we do in social studies. I have had the opportunity to teach a variety of social studies classes and even online learning. I like to have students make graphic organizers so that they can see how concepts are connected. When a web graphic organizer is completed on paper, lines begin to cross and once you get so many there is no hope of using it to study without some help.
In Lucidchart, students are able to make shapes and lines different colors for various levels of connections. In Lucidchart students can work collaboratively on the same web or individually on their own. On laptops it is simply shared through Google Drive; on the iPad, you just use the app.
In my AP class I made a master copy and then sent a copy to all my students through their cypanthers Google accounts. I put them in groups and they worked together to complete the graphic organizer (they were to look for advantages and disadvantages). Everyone got to see the information, but was only responsible for completing part of it. I am able to keep a master copy; the un-answered form of this diagram, so that I won’t have to recreate it every year.
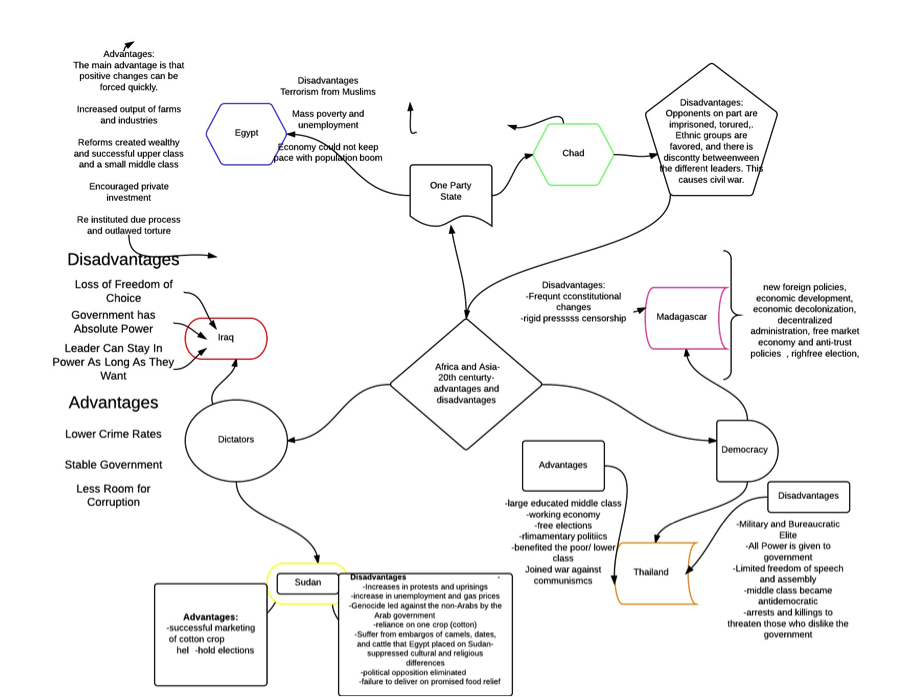
With my Freshmen I went at it a different way. I had each one of them create their own web, but they got to work as a group to find the information. By creating their own, it allowed them some choice in where they placed the words. Some grouped everything in the same bubble. Others added more bubbles to the diagram. (see example below)
I also had them create several Venn diagrams to compare and contrast information. Many like this option over drawing circles freehand because they like perfect circles.
I also had them create several Venn diagrams to compare and contrast information. Many like this option over drawing circles freehand because they like perfect circles.
Hopefully you can find a way to make this work in your classroom!
